Explainer
How to estimate a Shopify store's revenue — and how wrong it can be
Where store revenue estimates actually come from, why the error bars are much wider than anyone shows you, and what to count instead when you need something solid.
Published 9 min read
Nobody outside a shop knows what it makes. Every revenue figure you have seen next to a shop's name — on any tool, in any article — is an estimate built from public signals, and the honest version of it is a wide range with a confidence label, not a single number. This explains how those estimates are built, why they are so much less precise than they look, and what to count instead when you need something you can defend.
The short versionLink to this section
- Revenue estimates are usually traffic × conversion rate × average order value, where all three are themselves estimates or assumptions.
- Small errors in the assumptions multiply, so the output can be out by a factor of two or three without anything being obviously wrong.
- For small shops there is often no usable estimate at all — not a low number, no number.
- An estimate is useful for order of magnitude and for comparing similar shops, and close to useless as a precise figure.
- The things you can count — product numbers, price ranges, how often new products appear — are facts, and often answer the real question better.
Where the number comes fromLink to this section
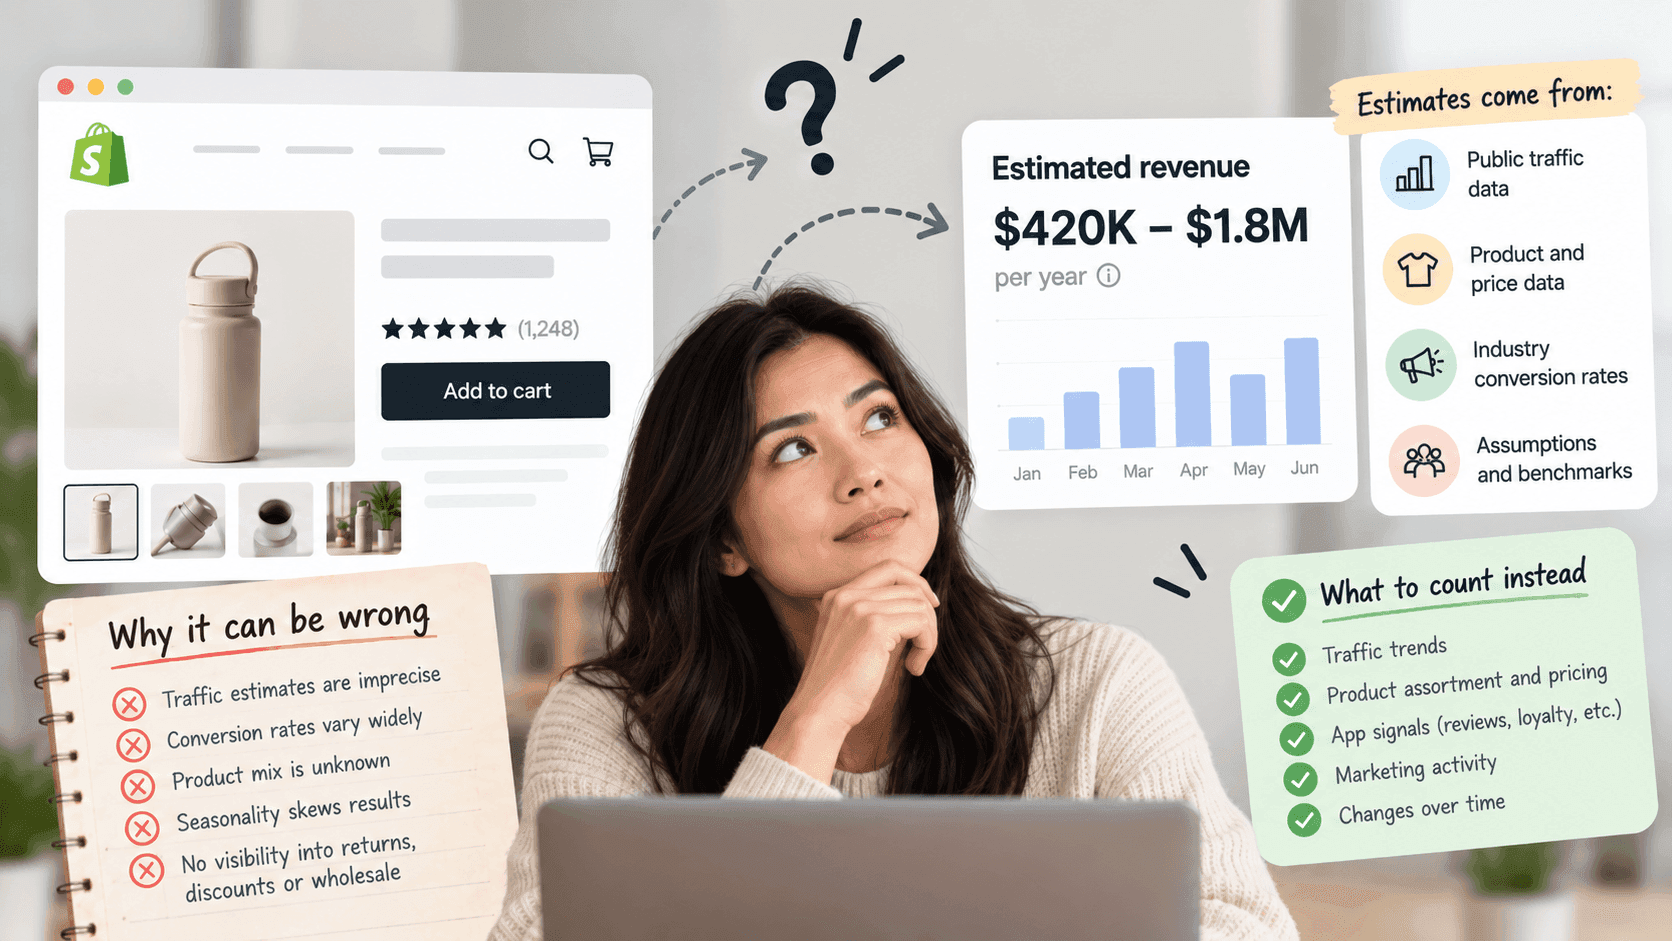
Almost every public revenue estimate is the same piece of arithmetic:
estimated monthly visitors × an assumed conversion rate × an assumed average order value
Each of the three inputs comes from somewhere different, and each brings its own uncertainty.
Estimated visitors is itself an estimate, usually built from a mixture of browser and network data that gets extrapolated up to a whole-internet picture. It is generally better at big sites than small ones, and it is a model, not a counter.
Conversion rate — the share of visitors who buy — is not published by shops and cannot be seen from outside. It is assumed, sometimes adjusted by the shop's category. It varies enormously between a £9 impulse product and a £900 considered purchase, and between a shop with a loyal returning audience and one buying cold traffic.
Average order value is estimated from the shop's listed prices, sometimes weighted by which products look prominent. It is the input we can get closest to honestly, because prices are published — though even there, discount codes and basket-level offers are invisible, so the real amount taken per order is lower than the shelf prices suggest.
Why small errors become big onesLink to this section
Because the three numbers are multiplied, their errors multiply too.
Here is the arithmetic with invented round numbers, purely to show the shape — these are not measurements and not typical figures for anything:
| Figure | Estimate A | Estimate B |
|---|---|---|
| Monthly visitors | 100,000 | 70,000 |
| Conversion rate | 2% | 1.4% |
| Average order value | £50 | £40 |
| Monthly revenue | £100,000 | £39,200 |
Estimate B is not wild. Each of its three inputs is 30% below A's — the sort of gap that is entirely ordinary between two reasonable models. The outputs differ by more than two and a half times.
This is the single most important thing to understand about these numbers, and it is why we publish ranges. A tool showing you one confident figure has not eliminated that uncertainty. It has hidden it.
The things the arithmetic cannot see at allLink to this section
Even a perfect version of that calculation would miss:
- Sales that do not happen on the website. Wholesale, marketplaces, physical shops, pop-ups, trade accounts. A brand with a strong wholesale business can look small online and be much bigger than the estimate.
- Returns and refunds. The estimate is gross. A category with heavy returns — clothing, especially — can lose a large slice of that between the order and the bank.
- Discounts. Codes and basket offers reduce what is actually taken and leave the listed prices untouched.
- Different prices in different countries. Shopify lets a shop assign a catalog of products, with its own pricing, to a market — a country or group of countries. The prices you see are one version of several.
- Costs. Revenue is not profit, and it is not even close in categories with paid traffic. A shop turning over a lot while paying for every visitor may be in worse health than a smaller one with an email list.
What we found when we tested thisLink to this section
We put real store lookups through our own system against a set of public shops in September 2026. Two results are worth passing on, because they change how you should read any estimate:
Small shops often produce no revenue estimate at all. Not a small number — no answer. For shops with a few dozen products, the estimate step simply failed every time we tried it. The honest interpretation is that there was not enough public signal to model anything, and the honest thing for a tool to show in that case is "no estimate", not a number invented to fill the space.
"Zero visitors" usually means "no data". For smaller shops, the traffic data came back as zero visits in every month, with no countries and no sources. A shop with customers is not getting zero visitors. It is below the level where the measurement works at all. Any chart that draws that as a flat line at zero is telling you something false.
There is a third, duller limit worth knowing: the traffic history available to us covers about three months, not years. That is enough to spot a recent swing and nowhere near enough to judge a seasonal business.
(These are observations from testing across a handful of shops, not a study. They tell you what the tooling does; they are not a statistic about Shopify stores in general, and we are not going to present them as one.)
How to use an estimate without embarrassing yourselfLink to this section
Use it for order of magnitude. "This is a six-figure-a-year shop, not an eight-figure one" is usually supportable. "This shop makes £13,480 a month" is not.
Compare like with like. Estimates are most useful relatively. If two shops in the same category are modelled the same way, the statement "A looks roughly three times the size of B" is far more robust than either number alone, because the shared assumptions cancel out.
Always attach a date and a confidence. We use three words consistently: high confidence when several independent public signals agree, medium when the method is sound but the inputs vary, low when the figure is a starting point for your own judgement and nothing more. Most revenue estimates for small and mid-sized shops are low confidence, and saying so is not a weakness.
Never present it as their revenue. Write "estimated", write the range, write the date. If you are putting this in a client deck, write the method in a footnote. The first question a good client asks is "where did this number come from?", and "a tool said so" is not an answer that survives it.
What to count insteadLink to this section
When you need something solid, count the things that are actually published. These are facts, not models:
- How many products the shop sells, and how that number moves month to month.
- The price range — cheapest, dearest, and roughly where the middle sits. A shop's pricing shape says a lot about who it is for.
- How much of the catalogue is marked down, and how deeply.
- How often new products appear. A shop launching something every week is running a different business from one launching twice a year.
- How many collections it maintains, and what they are organised around.
- What it visibly runs — subscriptions, reviews, bundles, loyalty.
None of these tell you the revenue. All of them are true, checkable today, and often answer the real underlying question — are they growing, and what are they betting on? — better than a modelled number would.
Red flags in any revenue estimateLink to this section
- A single precise figure with no range.
- No date.
- No confidence label, or a confidence that is always "high".
- A confident number for a shop with a handful of products.
- A figure that never changes between visits.
- Any claim to be accurate to within a specific percentage of real sales. Nobody outside the shop can verify that, which means nobody can honestly claim it.
Where this leaves youLink to this section
Use estimates for scale and for comparison. Use counted facts for anything you have to defend. And be suspicious of any tool — ours included — that shows you a number without showing you how uncertain it is.
StoreLenz is being built on that principle: estimates are shown as ranges with a confidence label, and when there is not enough signal to model a shop, it says so instead of inventing a figure. What it does today is written out plainly, including the parts still being built.
The rest of this series: Estimates and how far to trust themLink to this section
This article is the starting point. Each of these goes deeper into one part of it:
- Why small stores produce no revenue estimate at all
- How to read a store's traffic chart honestly
- What "confidence" means on an estimate, and why one number is a red flag
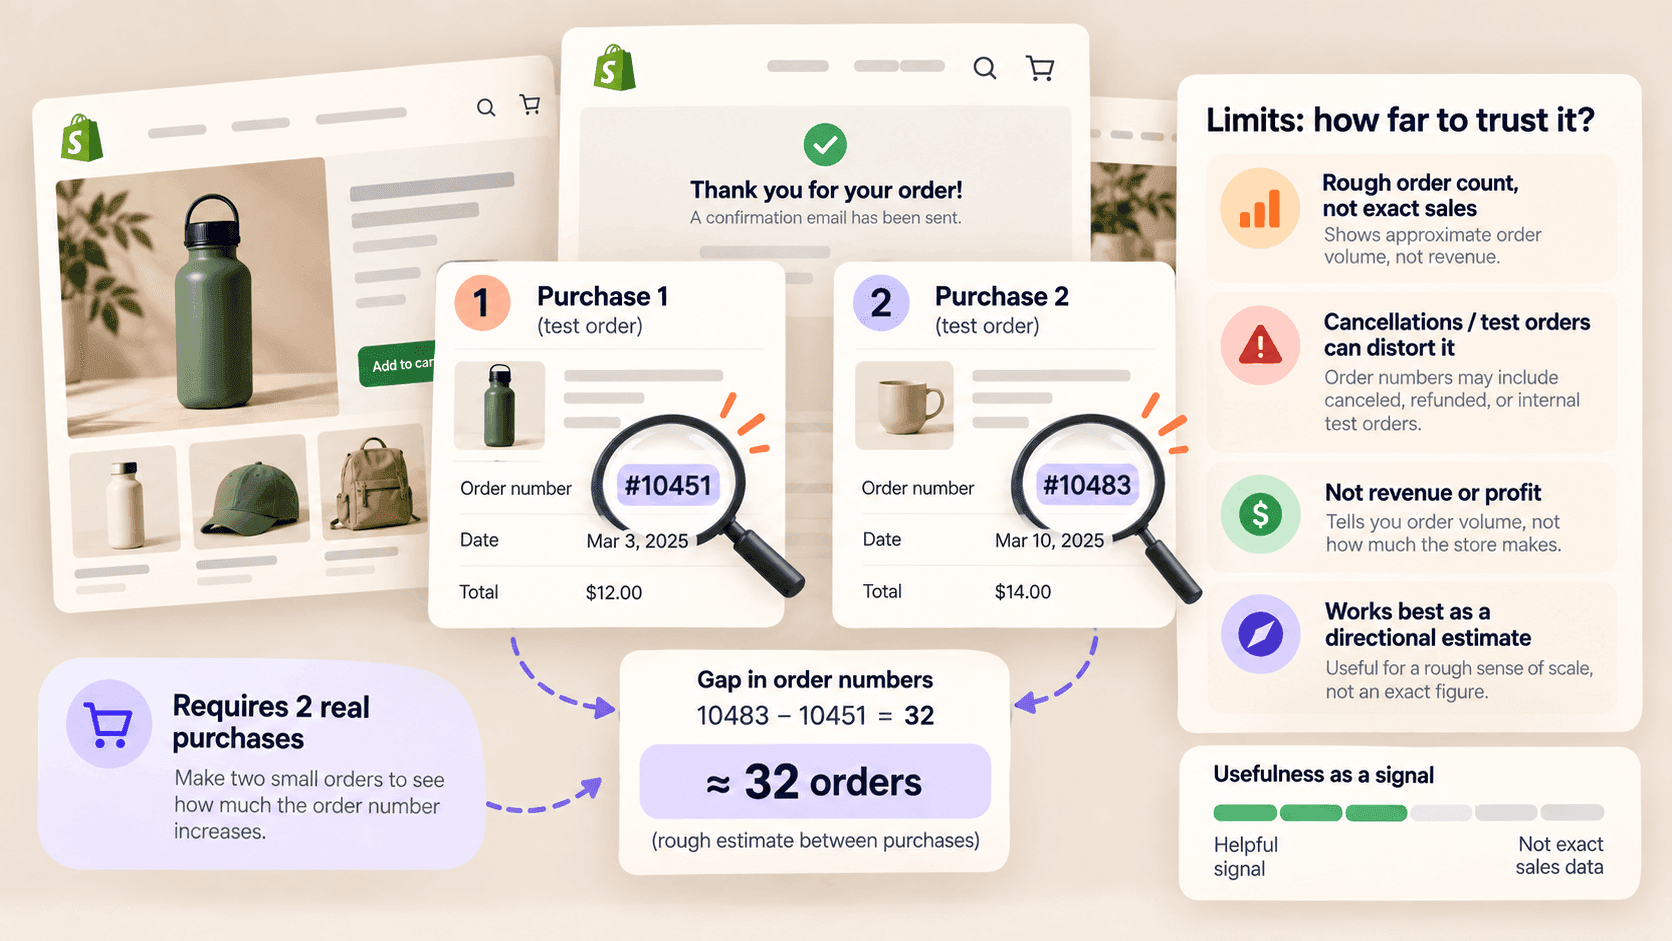
- The order-number trick: estimating a Shopify store's sales, and its limits
Related readingLink to this section
- Shopify competitor analysis: a practical guide
- How to track a competitor's price changes
- How to tell if a website is built on Shopify
SourcesLink to this section
- Shopify Help Center, Creating catalogs for markets ("A catalog is a set of products with optional custom pricing that you assign to a market") — https://help.shopify.com/en/manual/markets/customizations/catalogs — read 2026-09-22
- Shopify Help Center, Setting sale prices for products — https://help.shopify.com/en/manual/products/details/product-pricing/sale-pricing — read 2026-09-22
- Our own testing of store lookups, revenue estimates and traffic data against a set of real public shops, September 2026. Described qualitatively above; not a study, and not presented as a statistic about Shopify stores generally.
Written by Cristiano Pinto
shopify store expert