Explainer
Are Shopify revenue checkers accurate? An honest look at how they guess
What Shopify revenue checkers can and cannot know, what a confidence label really means, and why one precise number is a red flag.
Published 6 min read
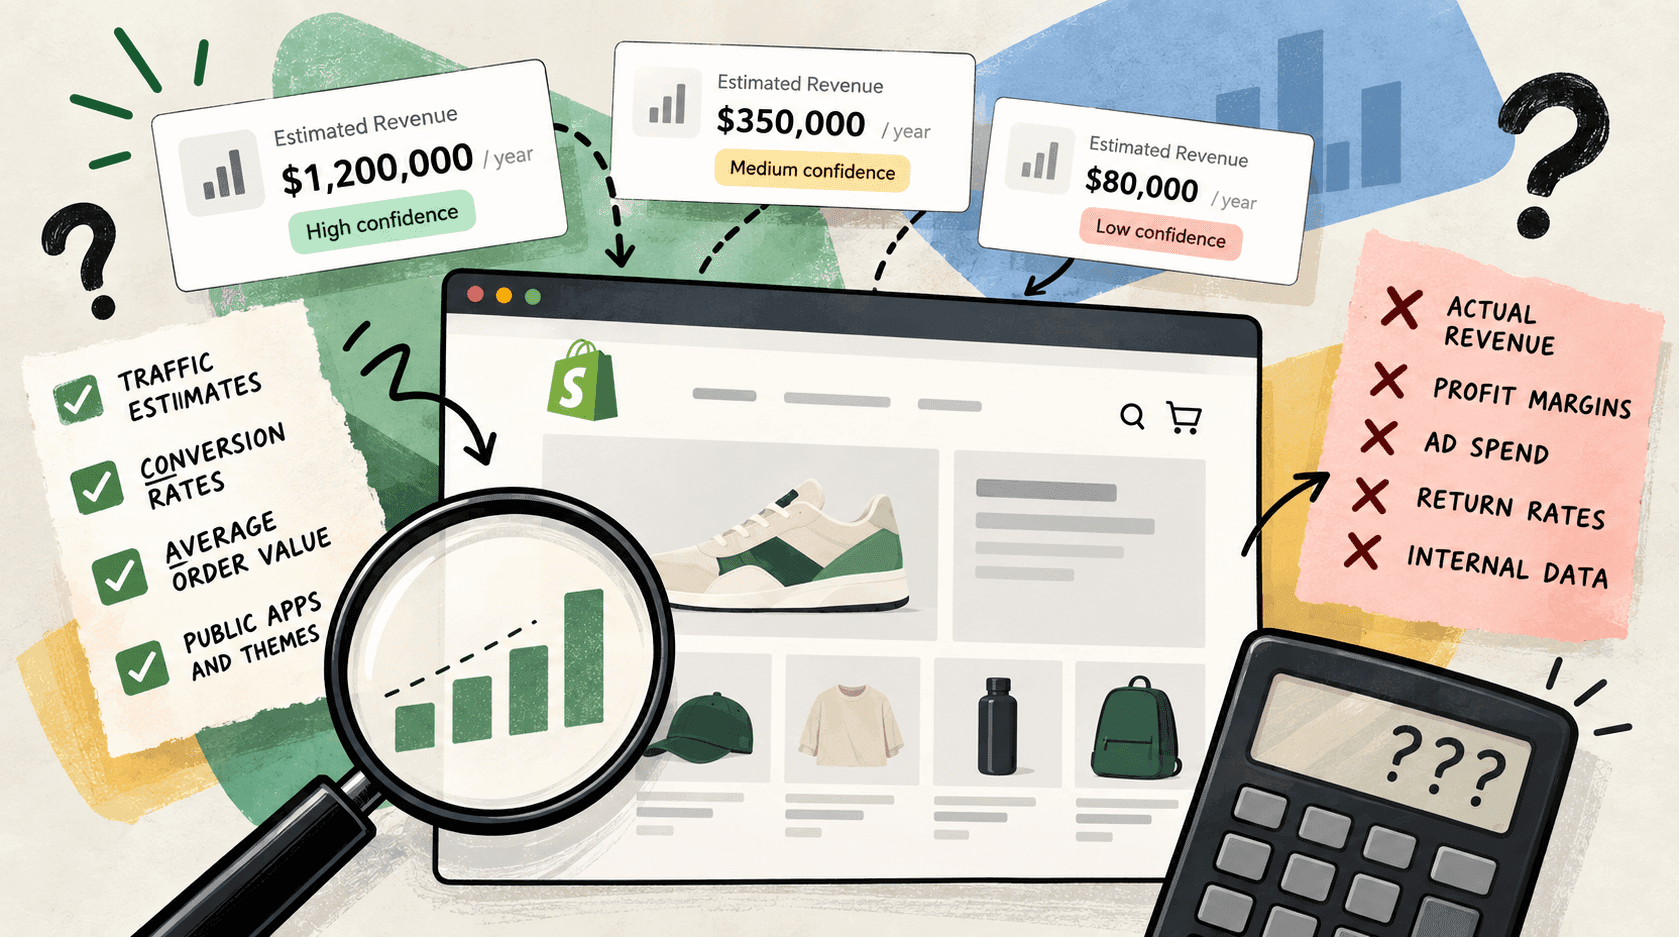
A confidence label tells you how much of the estimate is measurement and how much is assumption. High confidence means several independent public signals point the same way. Low confidence means the number is a starting point for your own judgement and nothing more. It is a judgement about the inputs, not a statistical probability — and any estimate that arrives without one is hiding information you needed.
The three labels, and what each one licenses you to sayLink to this section
High confidenceLink to this section
Several independent public signals agree, and the thing being estimated is close to something directly observable.
What you may say: the figure, as a range, with the date. You can put it in a document and defend it.
In practice: this label belongs mostly to counted things and near-counted things — how many products a shop lists, its price range, how much of its range is discounted. These are read from what the shop publishes rather than modelled, which is precisely why the confidence is high.
Medium confidenceLink to this section
The method is sound and the inputs vary. There is real signal here, and there is also real room for the answer to be out by a meaningful margin.
What you may say: the range, with the date, described as an estimate. Comparisons between two shops measured the same way are reasonable. A single figure is not.
In practice: this is where a large shop's traffic estimate usually sits.
Low confidenceLink to this section
The inputs are thin, or the model is doing most of the work, or both.
What you may say: that it is a starting point. Use it to decide whether a shop is in your league, never to decide anything that depends on the number being roughly right.
In practice: revenue estimates for small and mid-sized shops live here, and so does almost anything derived from a small shop's traffic.
Why a confidence label is not a percentageLink to this section
We use words rather than "87% confident", and the reason matters.
A percentage implies the uncertainty has itself been measured — that somebody compared many estimates against known true answers and counted how often they landed. For shop revenue, nobody outside those shops can do that, because the true answers are private. Any percentage attached to this kind of estimate is a number invented to look rigorous.
So the labels are an honest summary of how much assumption went into the figure. That is less impressive-looking and more truthful, and we would rather be the second thing.
Why one number without a range is a red flagLink to this section
When you see a shop's revenue given as a single precise figure, one of two things is true. Either the person showing it does not know how uncertain it is, or they do and have decided not to tell you.
The arithmetic behind these estimates multiplies several uncertain inputs together, so their errors multiply too — the worked example is here. A presentation that collapses all of that into one figure has not removed the uncertainty. It has moved it onto you, silently, and you will be the one holding it when someone checks.
The same applies to a chart with no "no data" state. If a tool draws zero visitors for a shop that plainly has customers, it is presenting an absence of measurement as a measurement — which is its own article.
How to act on each labelLink to this section
| Confidence | Reasonable decision | Unreasonable decision |
|---|---|---|
| High | Put it in a client document; compare shops; set a target against it | — |
| Medium | Decide whether a competitor is in your league; spot a large change | Set a price against it; forecast from it |
| Low | Sort shops into rough tiers; decide who is worth watching | Anything a colleague would later ask you to justify |
| No estimate | Count facts instead — products, prices, launches | Assume "no estimate" means "small" |
That last row is the one people get wrong. A missing estimate is not a low number. It usually means the shop is below the level where outside measurement works, which says nothing at all about whether the business is any good.
Where the confidence actually comes fromLink to this section
It is worth knowing what moves an estimate up or down the scale, because the same reasoning works on anyone's numbers, not only ours.
How directly the thing is observed. A product count is read straight off what the shop publishes. A revenue figure is three assumptions multiplied together. The further the number sits from something published, the lower the confidence, and no amount of modelling closes that gap.
How much signal the shop produces. A busy shop generates enough observed activity for a model to work with. A quiet one does not, and no method compensates for absent data — it only hides the absence.
How stable the inputs are. A shop with steady prices and a steady range is easier to characterise than one that changes everything monthly. Volatility is not noise to be smoothed away; it is a real property of the shop, and it widens the honest range.
Whether independent signals agree. This is the strongest one. If a shop's product count, its price range, its launch rate and its traffic estimate all point the same way, the picture is trustworthy even if no single number is precise. When they disagree, at least one of them is wrong and you usually cannot tell which.
That last point is why a range built from several signals beats a single figure from one. It is also why "high confidence" in our labels almost always means "several things agree", rather than "we measured it very carefully".
Three questions to ask of any estimate, from any toolLink to this section
- What is the range? If the answer is "there isn't one", you are looking at a presentation choice, not a measurement.
- When was it measured? Competitor data ages in weeks.
- What happens when there is not enough data? Ask what the tool shows for a very small shop. A tool that always has an answer is filling gaps, and you cannot tell which answers are filled.
That third question is the most revealing one you can ask about any research tool, including ours.
What this means for how we show numbersLink to this section
Estimates in StoreLenz are shown as ranges with one of the three labels above, and when there is not enough signal to model a shop, the answer is that we cannot tell you rather than a number invented to fill the space. It makes some screens look less impressive than they might. It also means that when we do show a figure, you know what weight it will bear. What the product does today is written out plainly.
Related readingLink to this section
- How to estimate a Shopify store's revenue — and how wrong it can be
- How to read a store's traffic chart honestly
- Why small stores produce no revenue estimate at all
SourcesLink to this section
- No external sources: this article defines the confidence labels we use and contains no external fact, statistic or figure for any real shop
Written by Cristiano Pinto
shopify store expert