Explainer
How to check a Shopify store's traffic (and why every number is a range)
How to check roughly how much traffic a shop gets, why every figure is an estimate rather than a count, and the four ways the numbers mislead.
Published 8 min read
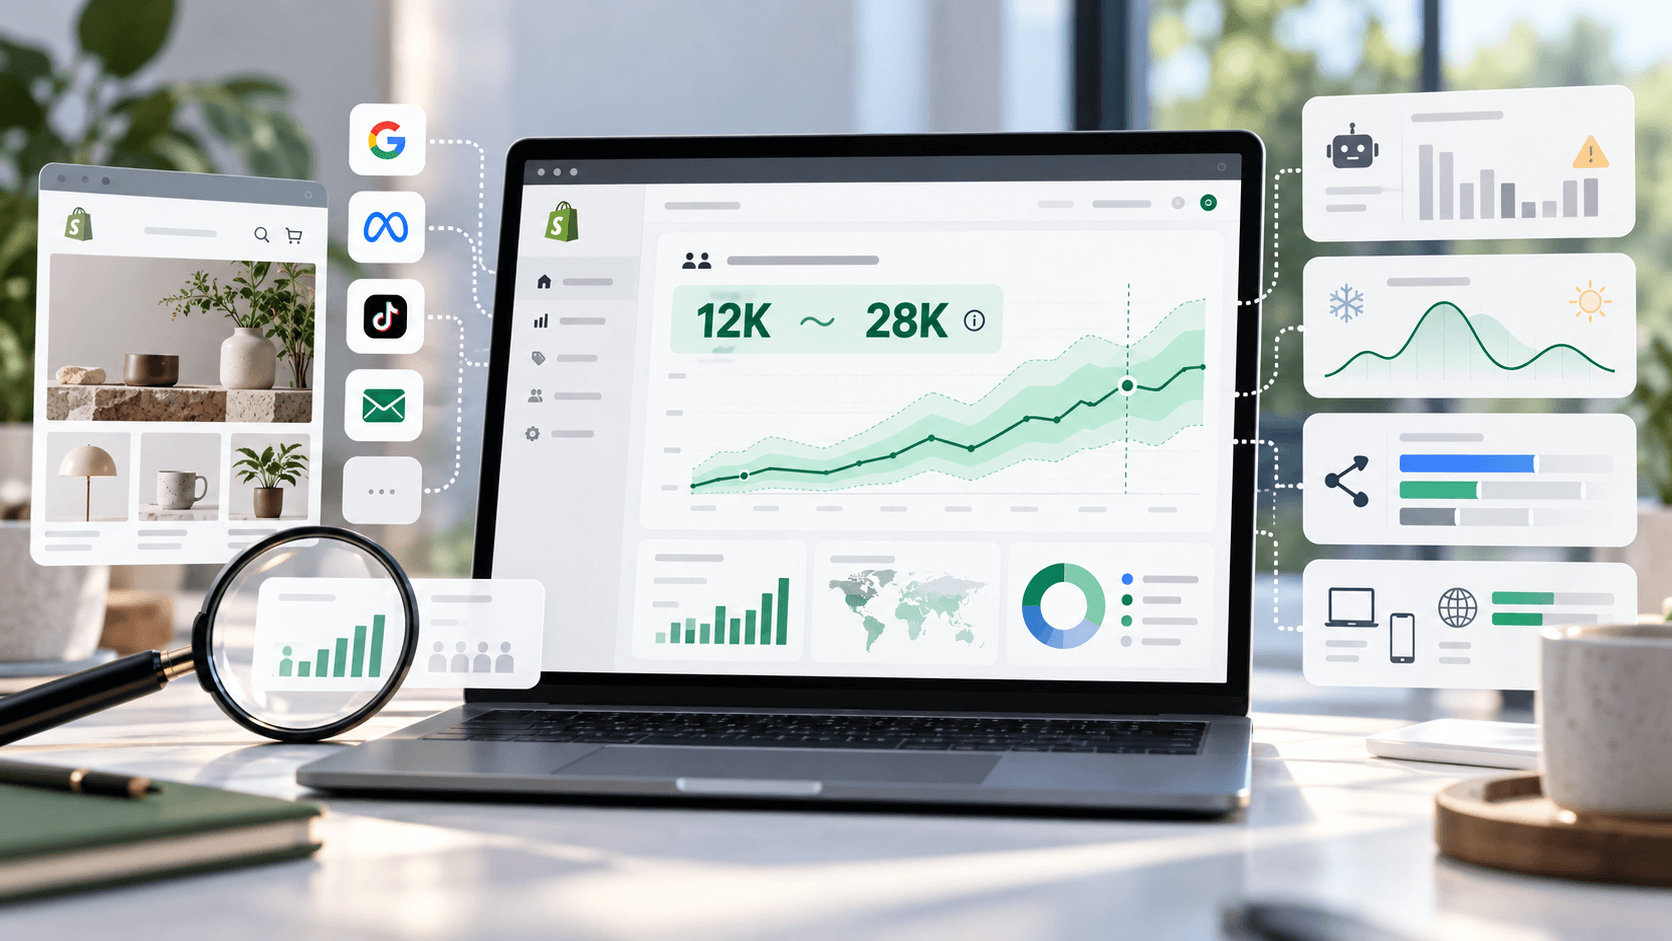
You cannot check a Shopify store's traffic exactly — nobody outside the shop can. What you can get is an estimate, from a traffic-estimating service or from a competitor tool that uses one, and the honest form of that answer is a range rather than a figure. For a large shop it will be roughly right; for a small one it will often be zero, which means "too small to measure" rather than "no visitors". Here is how to get a number, what it actually represents, and the four ways the chart misleads people.
How to check it, in practiceLink to this section
There is no free, exact method, so be clear about what you are choosing between:
- A traffic-estimating service. Paste the shop's address into any of the well-known estimators. They all work
the same way — a sample of browsing behaviour, scaled up — so they will disagree with each other, and that disagreement is a fair picture of the uncertainty.
- A competitor tool that shows traffic alongside everything else (StoreLenz is being built to do this). Same
underlying kind of estimate; the advantage is that it sits next to the shop's products, prices and changes, which is usually what you actually wanted to know.
- Proxies you can count yourself, when the estimate comes back empty. Product count and how fast it grows,
review counts, how often the shop posts. These are facts rather than models, and for a small shop they tell you more than a traffic figure would — see why small stores produce no estimate at all.
Whichever you use, write the answer down as a range with a date. The rest of this article is why.
What is being measuredLink to this section
Nobody outside a shop can count its visitors. What these estimates do instead is observe a sample of people browsing the web and scale that sample up.
Two consequences follow, and they explain almost everything else:
- Big sites are estimated better than small ones. More observed visits means less noise. A large shop's figure
is a reasonable approximation; a small shop's is mostly noise, and below a certain size it produces nothing at all — which is its own article.
- The sample is not the population. Whoever is in the sample shapes the answer. A shop whose customers are
concentrated in a country, an age group or a device that happens to be under-represented will be under-estimated, consistently, and nothing in the chart will tell you that.
The four ways a traffic chart misleadsLink to this section
1. Zero does not mean zeroLink to this section
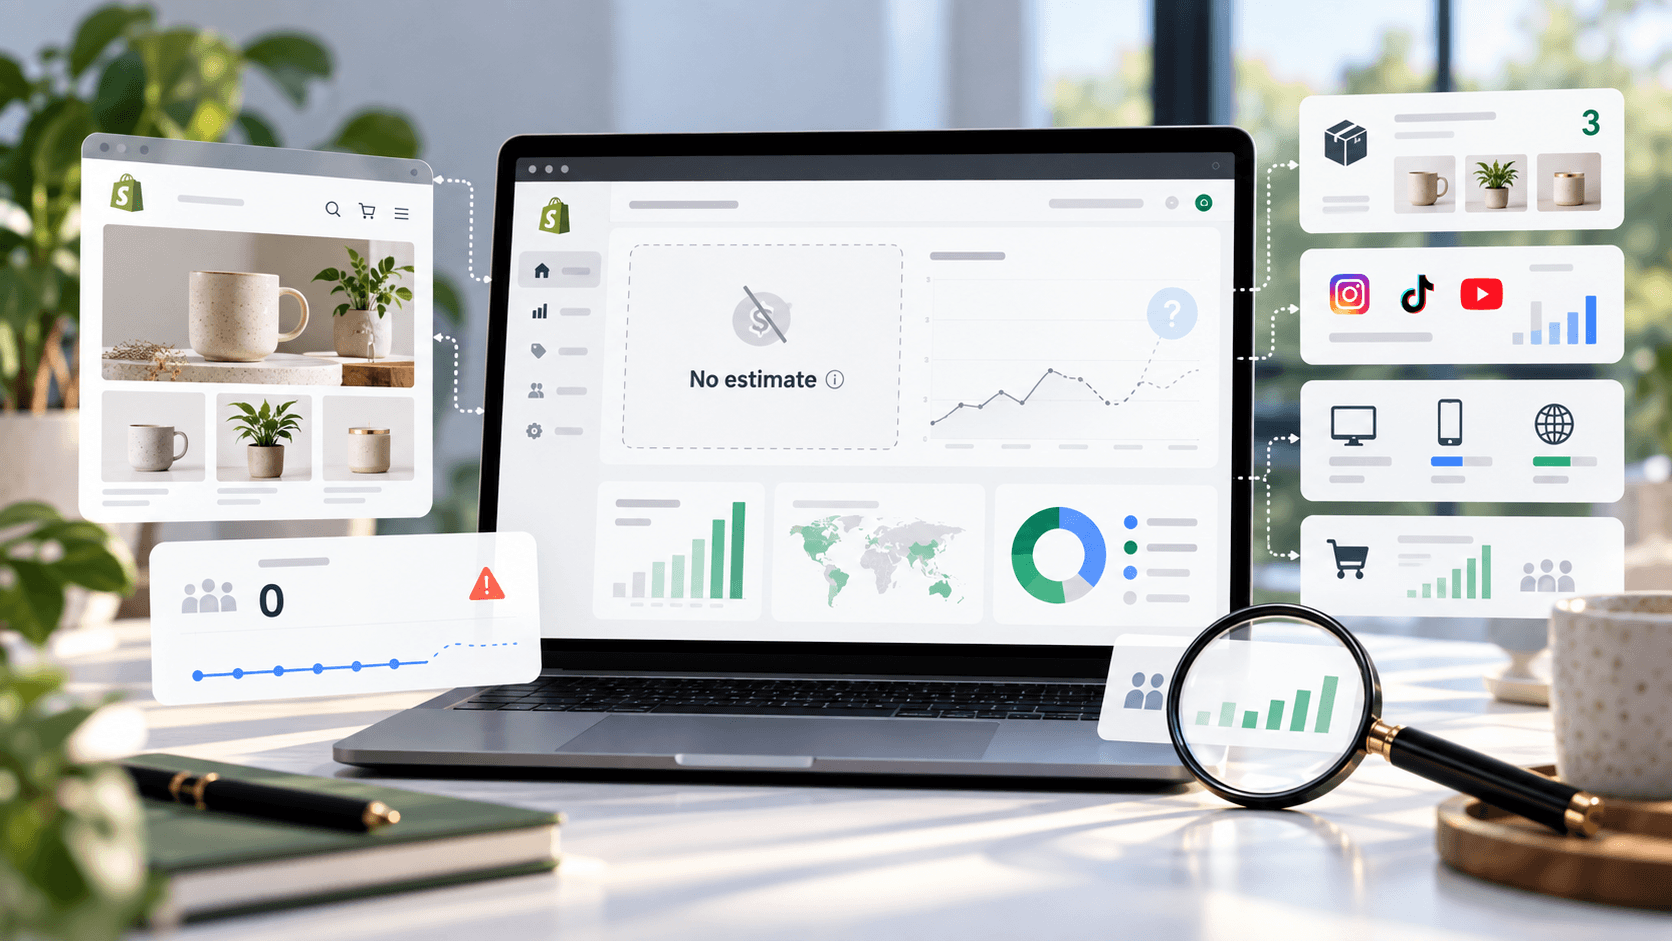
The most damaging one. When we tested traffic data across real public shops in September 2026, smaller shops came back as zero visits in every month, with no countries and no sources listed — shops with functioning checkouts and real customers.
Zero in these charts almost always means below the level where this can be measured. Drawn as a flat line along the bottom, it looks like a dying business. Read it as "unknown".
2. Three months is not a seasonLink to this section
The history available to us runs about three months, not years. Three months cannot tell you whether a shop is growing, because it cannot separate growth from a season.
A garden shop in spring, a gift shop in November and a swimwear shop in June all look like rocket ships over a twelve-week window. The same shops look like collapses a quarter later. Never describe a trend you have only seen once. If you need to judge a seasonal business, you need a year, and if you do not have a year, say so.
3. Precision that is not thereLink to this section
A figure like 47,300 visits invites you to compare it with 45,100 and conclude something. Those two numbers are almost certainly within each other's margin of error. Treat any difference under roughly a third as noise unless you have several months showing the same direction.
4. Traffic is not customersLink to this section
A shop can buy a lot of visitors. High traffic with a thin product range and heavy discounting often means expensive traffic converting badly, which is a worse position than a quieter shop with a loyal mailing list. Traffic is an input, and it tells you nothing about the quality of the business behind it.
What a traffic chart is genuinely good forLink to this section
Comparing two shops measured the same way. This is the strongest use. The model's errors largely cancel out, so "this shop looks roughly three times the size of that one" is far more defensible than either number on its own.
Spotting a large, sudden change. A shop whose estimate doubles or halves within a month has usually done something real — a campaign, a press mention, a site problem, a change of address. The size of the move is unreliable; the fact of it is a useful prompt to go and look at the shop.
Establishing a rough tier. Is this a shop with thousands of monthly visitors or hundreds of thousands? That question the chart answers well, and it is usually the one that matters for deciding whether a competitor is in your league.
How to write about traffic without overstating itLink to this section
Three habits:
- Say "estimated", every time. Not "their traffic" — "their estimated monthly visitors".
- Give a range and a date. "Somewhere in the tens of thousands a month as of September 2026" beats a precise
figure, and it is more likely to still be true when someone reads it.
- Say what the history covers. "Based on three months of estimated data, which is not long enough to show a
seasonal pattern" is one sentence and it prevents the most common misreading.
If a client or colleague pushes for a single number, the honest answer is that a single number would be made up precision, and here is the range instead.
Why the shop's own numbers would look differentLink to this section
It is worth knowing how far apart an estimate and the shop's own analytics can be, because if you ever compare the two you will be surprised.
A shop's own analytics counts sessions on its own site, with its own definitions, including visits from the owner, staff, developers and every automated checker. An outside estimate is a scaled-up sample of consumer browsing which has no idea any of those exist. The two are measuring related but different things, and neither is "the truth".
The practical upshot: never present an estimate to a shop owner as what their traffic is. They have the real number, it will not match, and the mismatch will discredit everything else in your document. Present it as what it is — an outside estimate, useful for comparison between shops, not for auditing one.
What about the country and traffic-source breakdowns?Link to this section
Estimates usually come with extra detail: which countries visitors come from, which channels they arrive through. The same caution applies, only more so, because each breakdown slices an already-uncertain number into smaller pieces.
Use them for shape, never for precision. "Most of their visitors appear to be in the United Kingdom, with a noticeable share in Germany" is a reasonable reading. "14% of their traffic is from Germany" is not — that figure carries all the uncertainty of the total, plus the uncertainty of the split.
And when a shop is small enough that the total is unreliable, the breakdowns are not just unreliable but frequently empty — no countries, no sources at all. That is the same "no data" problem in a different costume.
What we do with thisLink to this section
Traffic in StoreLenz is shown as what it is: an estimate, over the history that genuinely exists, with "no data" shown as no data rather than as a zero. When a shop is too small to measure, the honest answer is that we cannot tell you — and for a small competitor there are better things to count anyway. What the product does today is written out plainly, including the parts still being built.
Related readingLink to this section
- How to estimate a Shopify store's revenue — and how wrong it can be
- Why small stores produce no revenue estimate at all
- Shopify competitor analysis: a practical guide
SourcesLink to this section
- Our own testing of traffic data across a set of real public shops, September 2026: the available history ran about three months; smaller shops returned zero visits in every month with no countries or sources listed. Described qualitatively — the sample is too small for a statistic and none is given
- No external sources: no third-party traffic figure is quoted anywhere in this article, and no figure for any named shop appears
Written by Soneth Martins
shopify store manager