How to
How to read a competitor's price bands instead of chasing products
Watching individual prices is a losing game. Here is how to read a shop's whole price shape in five numbers, and what each one tells you about their strategy.
Published 7 min read
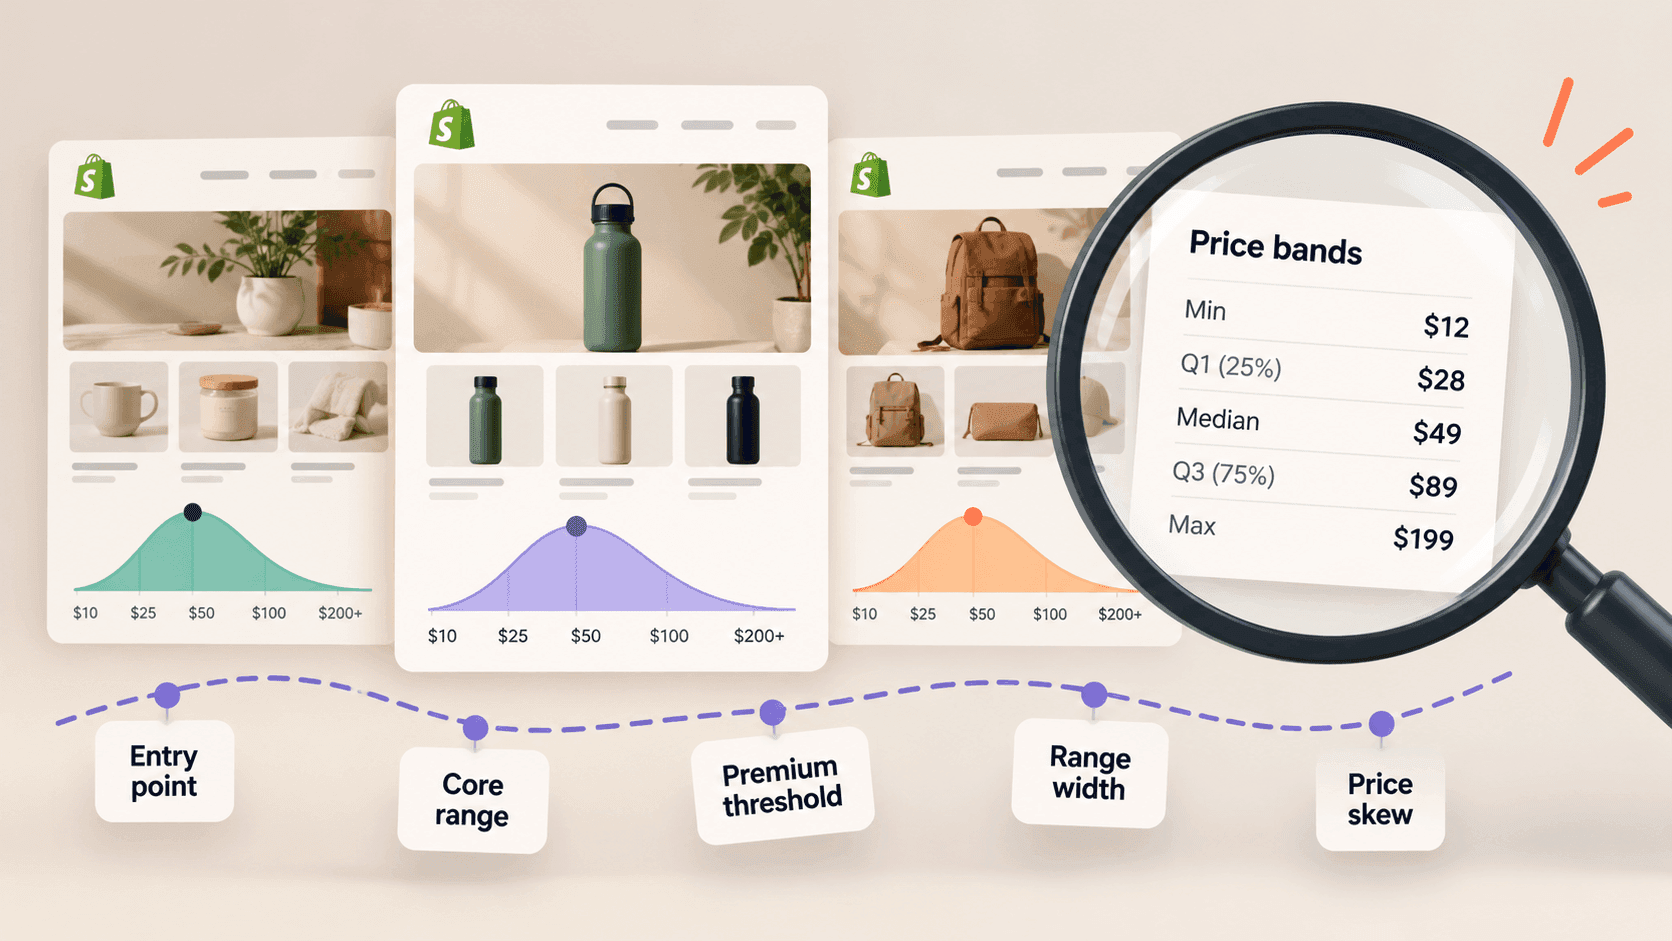
Tracking individual products is where most competitor pricing work dies: it is a lot of effort for a fact that rarely changes a decision. Reading the whole shape instead takes five numbers, about ten minutes a month, and tells you something a product-by-product chase never will — whether a competitor is quietly moving upmarket, buying share, or clearing stock.
The five numbersLink to this section
Pull the shop's product list into a spreadsheet — the method is here — and work out:
- The lowest price. Their entry point: the cheapest way in for a new customer.
- The highest price. Their ceiling: what they think their best customer will pay.
- The middle. Sort every price and take the one in the centre. This is the single most useful number, and it is not the same as the average — one £400 item would drag an average upwards and leave the middle untouched.
- The spread. Take the price a quarter of the way up the list and the one three quarters of the way up. Most of their range sits between those two, and that band is what the shop really sells.
- How much is discounted, and by how much. Count the products whose compare-at price is higher than their price, and work out the typical gap. Shopify's help pages describe how a shop sets that second figure when something goes on sale.
Write all five down with the date. Repeat monthly. Ten minutes.
What each one tells youLink to this section
A low entry point with a wide spread is a shop using cheap items to bring people in and making its money higher up. Expect bundles, upsells and a hard push on order value.
A narrow band is a focused proposition. Everything costs roughly the same, the customer's decision is which rather than how much, and the shop is competing on product and brand rather than on price.
A middle that drifts upward over months is the most valuable signal in this whole exercise. A shop whose middle price rises 10% over a quarter while its product count stays flat is repositioning — deliberately, and usually before they say anything about it publicly. (Example figures.)
A middle that drifts down is either a push for volume or pressure they are not talking about.
A permanently large discounted share is a pricing style rather than a promotion. If a quarter of the range is always marked down, that is how the shop prices; the markdown is theatre, not news.
A discounted share that spikes is a real event: a season ending, stock that has not moved, or a response to somebody else.
A worked example, with invented numbersLink to this section
Two shops, same category, same month. Every figure here is made up to show the method — none of it describes a real shop.
| Price point | Shop A | Shop B |
|---|---|---|
| Lowest | £12 | £28 |
| Quarter mark | £24 | £34 |
| Middle | £38 | £39 |
| Three-quarter mark | £52 | £46 |
| Highest | £180 | £72 |
| Discounted now | 4% | 26% |
Their middles are within a pound of each other, which is why comparing "average price" would have told you the two shops were the same. They are not.
Shop A sells a wide range: a cheap way in, a genuinely expensive top end, very little discounting. That is a shop with a considered range and enough demand to hold its prices.
Shop B sells a tight range with a quarter of it marked down at any moment. That is a shop competing much harder on price within a narrow band, and one whose real selling prices are meaningfully below its listed ones.
If you competed with both, your pricing response to each would be completely different — and the single "average price" number would have hidden that entirely.
Why this beats chasing productsLink to this section
It is less work. Five numbers a month per competitor, against hundreds of rows.
It survives their housekeeping. Competitors rename, re-photograph and re-tag products constantly. The shape of their pricing does not move when they tidy up.
It answers the question you actually have. You rarely need to know that one item went down by £2. You very often need to know whether a competitor is drifting into your territory.
It is comparable. Five numbers per shop per month lines up into a table that shows a market moving.
Watching the shape moveLink to this section
One month of five numbers describes a shop. Six months of them describes a decision.
Put the five numbers in a row per month and read down the columns rather than across. What you are looking for is not the month-to-month wobble but the direction over a quarter or more:
The middle moving while the range stays the same width is a straightforward repositioning: the same kind of shop, aimed slightly higher or lower.
The range widening at the top means a shop reaching for a more expensive customer without abandoning its existing one — usually a premium line launched alongside the core range.
The range widening at the bottom means a shop reaching for volume, and often that its acquisition is getting more expensive.
The band narrowing means a shop deliberately simplifying: dropping the outliers at both ends and concentrating on what works. This is frequently a sign of a business getting healthier, and it is invisible if you only watch individual products.
The discounted share rising while the middle falls is the pattern worth taking seriously. That combination — lower prices and more of them marked down — is a shop under pressure, and it usually shows up in the numbers a couple of months before anything is visible in how the shop presents itself.
When a single product does matterLink to this section
Keep a short list — three to five items where you compete head to head, where a customer would genuinely put your product and theirs side by side. Track those individually, using the full price method.
Everything else is better served by the bands. The mistake is treating all two hundred products as if they were all the head-to-head five.
What price bands cannot tell youLink to this section
What a shop actually takes per order. These are listed prices. Discount codes, basket offers and prices set for other countries are all invisible, so the real average is lower than the shelf figures suggest.
Their margins. A shop pricing below you may be making more per item.
Whether anything at that price is selling. A price band describes what is offered, never what moves. A shop can list an expensive top end that nobody buys.
Why the shape is changing. You will see the middle rise. Whether that is confidence, cost pressure or a deliberate repositioning is not in the data, and writing down a reason you cannot see is how research becomes fiction.
Doing it every monthLink to this section
The whole value is in the repetition, and the repetition is the part that lapses. StoreLenz is being built to keep these numbers current for the shops you name, so the monthly ten minutes is spent reading the trend rather than rebuilding the spreadsheet. Price and catalogue tracking are being built rather than finished today; what it does now says which is which.
Related readingLink to this section
- How to track a competitor's price changes
- How to see a Shopify store's whole product catalogue
- Shopify competitor analysis: a practical guide
SourcesLink to this section
- Shopify Help Center, Setting sale prices for products — https://help.shopify.com/en/manual/products/details/product-pricing/sale-pricing — read 2026-09-22
- Our own check of a public store's product list on 2026-09-22, confirming
priceandcompare_at_priceon every variant. Every figure in the worked example is invented to show the method
Written by Pinto Arkad
I love shopify